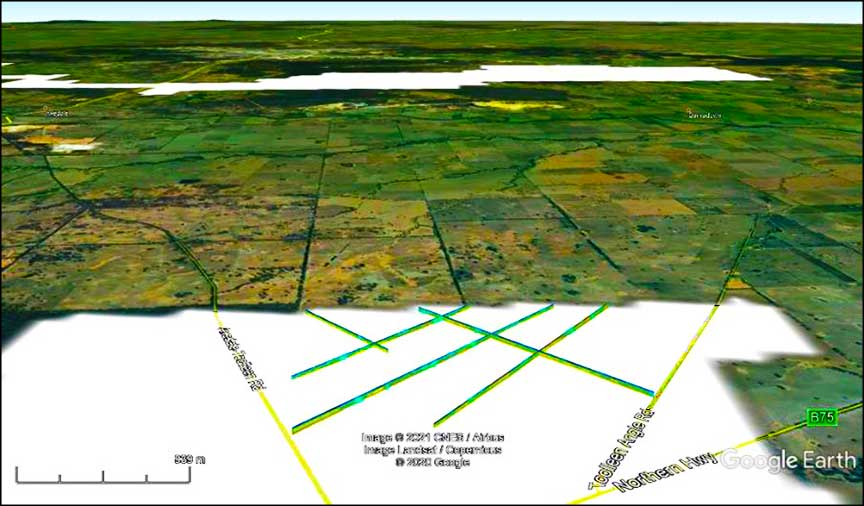
Fig-7-Shows-the-survey-data-with-aqua-coloured-gaps-highlighting-anomalies,-with-the-white-area-at-the-top-of-the-figure-being-the-Fosterville-mine-in-the-background
GOLD PRICE![[Most Recent Quotes from www.kitco.com]](https://www.kitconet.com/charts/metals/gold/tny_au_en_usoz_2.gif) | ABOUT PROJECTS INVESTORS NEWS INVESTOR SIGN-UP | CONTACT Martyn Element, Chairman E: me******@**********es.com Marc Enright-Morin, President & CEO E: ma**@**********es.com Kiki Smith, Chief Financial Officer E: ****@**********es.com">ks****@**********es.com | OFFICE AIS Resources Ltd. 1120 – 789 West Pender St. Vancouver BC V6C 1H2 Canada T: +1-604-687-6820 © Copyright - AIS Resources Ltd. TSX-V: AIS |
Buy Cialis online from online Canadian Pharmacy that offers free shipping Branding and Design:
NextPhase Strategy Marketing Inc.