A.I.S. Resources Bright Gold Project Assay Results, Pathfinder Exploration Update and Historical Findings
March 22, 2022
Vancouver, British Columbia – A.I.S. Resources Limited (TSX-V: AIS, OTCQB: AISSF) (the “Company” or “AIS”) announces it has received the assays from parts of diamond drill core GDD001 acquired from the Golden Bar reef on exploration licence EL006194. The exploration licence is a joint venture with Clarus Resources Pty Ltd in which AIS Resources holds a 60% interest.
Highlights
- Zones of alteration encountered in the first drill hole confirmed as horizons of gold mineralisation.
- Gold and alteration are coincident with modelled historic lodes
- Being close to the reef is implied by the low grade gold intersected up plunge at Golden Bar from historic lodes of the Red Leader and Shaws Reefs.
- Intervals from GBDD001 include 2.85m@0.33m g/t gold and 4,070ppm arsenic from 96.7m.
- In the next quarter, AIS plans to do follow-up drilling surrounding this hole and down-plunge, as well as the Golden Bar target.
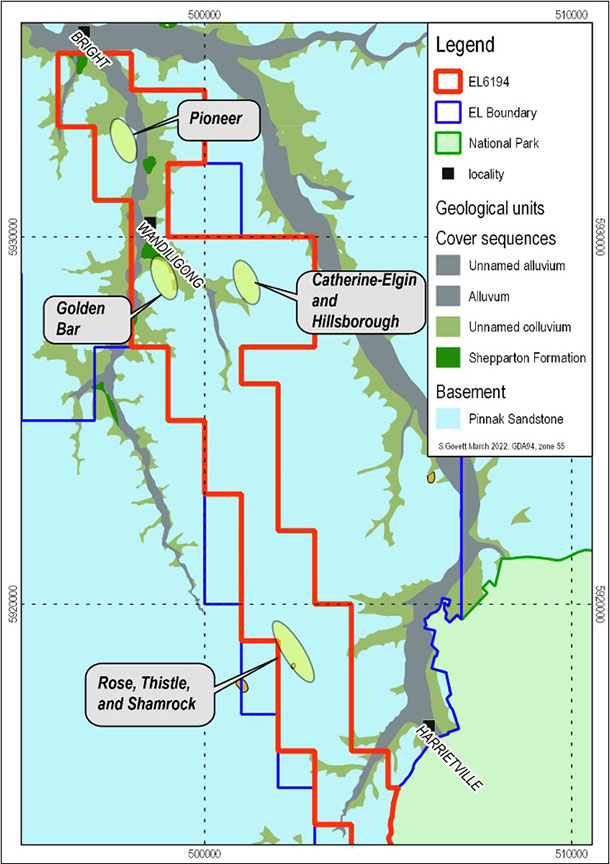
Fig. 1 – Prospect location map for Bright-EL5193.
Golden Bar Prospect
Drill holes GBDD001 and GBDD002 were drilled to test the down plunge intersections of Red Leader-Home Reef and Shaw’s-Home Reef respectively. Both holes have now been geologically logged, with the cutting of GBDD002 to be completed soon. The gold values returned from GBDD001, the intense sericite-sulphide alteration and part quartz replacement (Figure 2 through Figure 8) within the anticipated reef intersections demonstrates that the structures associated with the historic mining are as modelled. They are most likely on the margin of high-grade shoot historically mined, as demonstrated by the extremely high arsenic values.
Encouraged by these results, AIS has planned follow-up drilling surrounding this hole and down-plunge in the next quarter, which will include the Golden Bar target. Although within the same line as the Shaw’s, Home, and Red Leader reefs, the Golden Bar target has been shown to be resulting from a syncline intersection with the Golden Bar Reef structure. Along strike and down-plunge this setting provides for another target (Figure 4) to compliment that already tested by holes GBDD001 and GBDD002. Likewise, drilling at this prospect will incorporate targeting this setting below the extent of the historical mining front.
| HOLE | Easting (MGA) | Northing (MGA) | Elevation (m) | Depth (m) | |
| GBDD001 | 499060.863 | 5928821.89 | 456 | 110 | |
| HOLE ID | Azi (Mag. deg) | Azi (Grid deg) | Dec (deg) | Depth (m) | Mag Field (uT) |
| GBDD001 | 226.8 | 238.9 | -43.7 | 0 | |
| GBDD001 | 226.8 | 238.9 | -43.5 | 38 | |
| GBDD001 | 226.7 | 238.8 | -41.9 | 86 | 5995 |
Table 1 – DDH Hole GBDD001 co-ordinates
Historical Review – High Grades
A historical account of production comes from Kenny, 1966[1], and is the last record of mining immediately above these drill intersections. Earliest records of the prospect are incomplete, with surface mining estimated to have been initiated around 1865, and ending in 1905 on mining fronts associated with the Home Reef and Shaws Reef. It was calculated (appendix 3) that Shaw’s Reef yielded a grade of 10.14 g/t from 487.7 ton of ore and Home Reef yielded 22.28 g/t from 287 ton of ore. The weighted average from a total of 779.3 ton of ore is 14.66 g/t, with auriferous pyrite contributing between 1.2-1.5 g/t[2]. Both of these reefs plunge to the south-east at about thirty degrees.
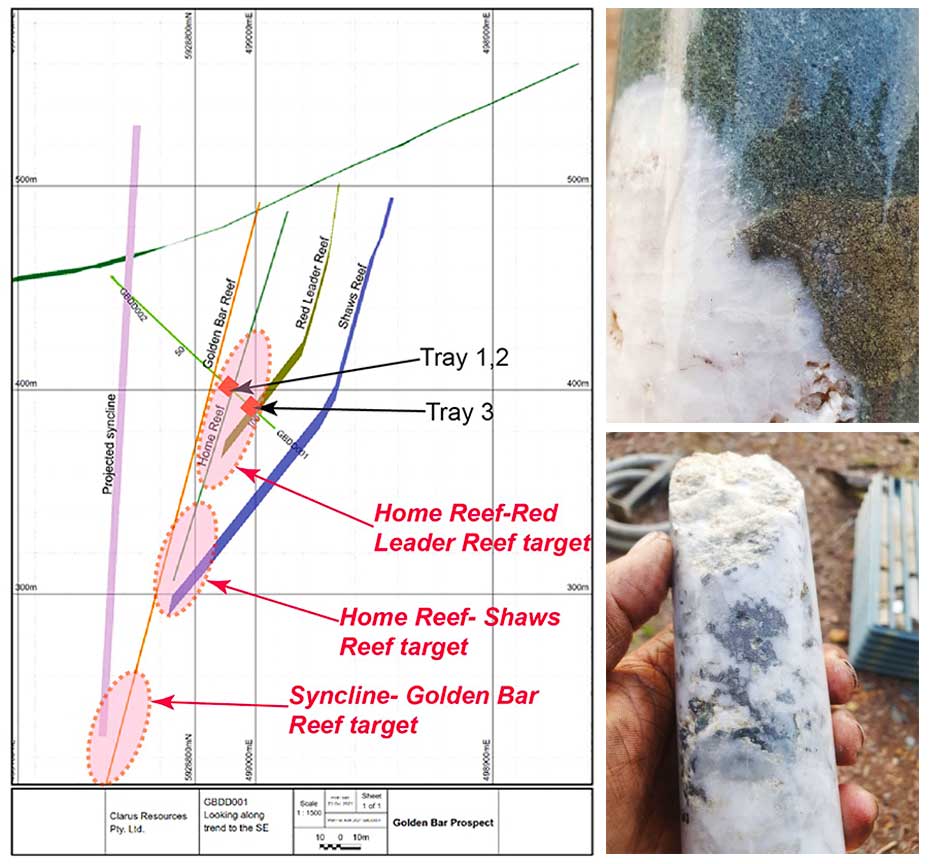
Fig. 2 Left – Drill Section for GBDD001 looking SE. • Fig 3 Upper Right – Vein hosted massive euhedral arsenopyrite, GBDD001 82.8m. • Fig 4 Lower Right – Massive pyrite associated with quartz-cabonate vein.

Fig. 5 – Massive arsenopyrite veinlet, 81.25m in GBDD001, preceding interval 81.75-82.5 which returned 2,949ppm As.
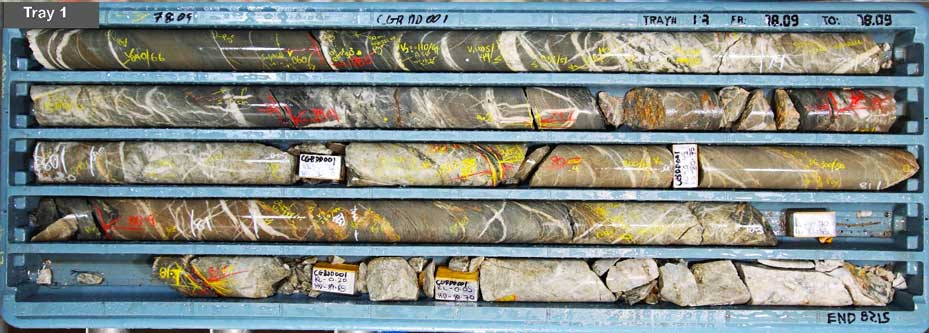
Fig. 6 – Tray 1 for Home Reef horizon 78.9-82.95m in GBDD001 (see section in Figure 4).

Fig. 7 – Tray 2 for Home Reef horizon 78.9-82.95m in GBDD001 (see section in Figure 4).
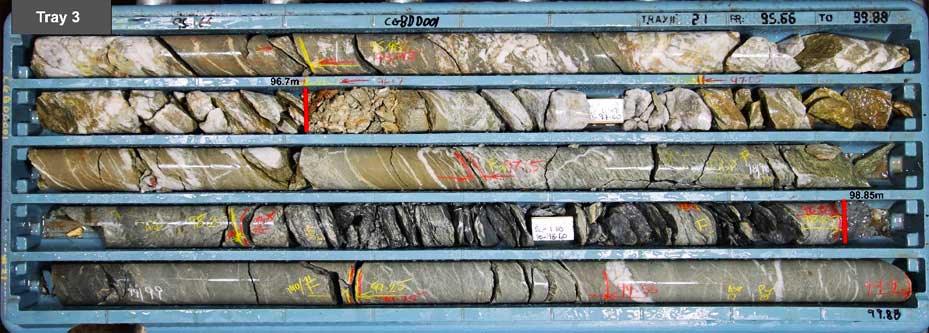
Fig. 8 – Tray 1 for Home Reef horizon 78.9-82.95m in GBDD001 (see section in Figure 4).

Fig. 9 – Location map of holes GBDD001 and GBDD002, Golden Bar Prospect. Both Hole Reef targets and Golden Bar target zones in yellow.
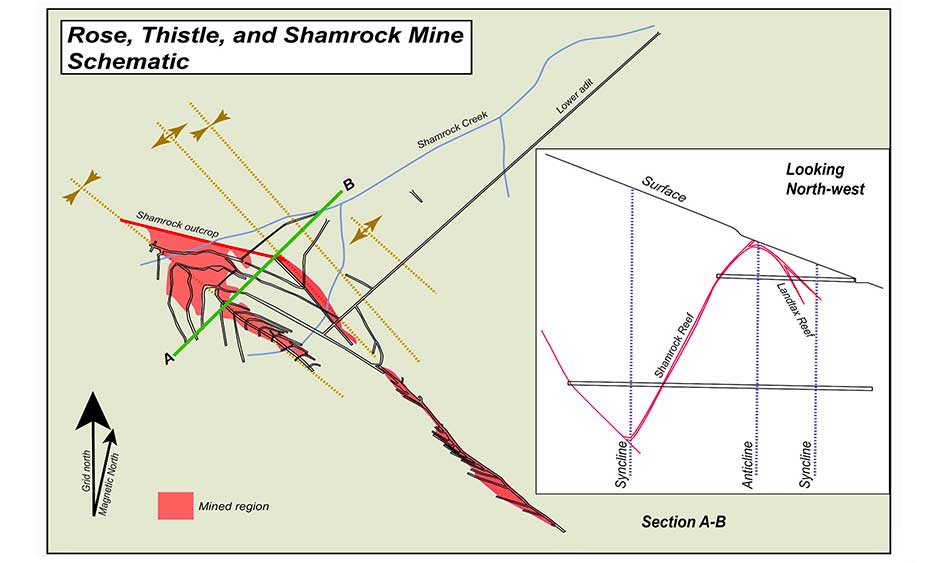
Fig. 10 – Diagram of the Rose, Thistle and Shamrock Mine.

Fig. 11 – Historic and recent surface geochemistry map for gold and arsenic, Rose, Thistle, and Shamrock Prospect. Note; soil contour (orange) is +20ppb gold
Earliest records of mining associated with the Rose, Thistle, and Shamrock (RTS) mine area are from 1861[1], which was mined periodically up until 1934[2]. It was the largest and last operating mine in the district. Total production during this period was 69,934oz. 102,864 ton of ore for a grade of 21.14 g/t[3], with widths of up to 2m being mined. The setting (Figure 10) is unique in that the lodes are largely constrained to the limbs and fold axis.
Modern exploration by Goldminco (1998), Target Minerals (2005), Clarus Resources (2020), and AIS during the quarter confirms that under exploited gold remains immediately to the north and east of the Rose, Thistle, and Shamrock workings (Figure 11). It is anticipated that a structural model similar to the RTS workings can form the basis of a general exploration model at this prospect. Following this earlier work, reconnaissance spur sampling (yellow ellipses Figure 11) has flagged previously unexploited or discovered surface outcrop mineralisation (ie.>90ppm arsenic, yellow ellipses). Several results are above 100 ppm arsenic with a peak value of 170 ppm. Reconnaissance activities are set to continue related to identifying historic workings by GPS and further infill soil sampling. After review of the controlling structures related to this mine, it is apparent that mineralisation is dominantly controlled and constrained to the limbs and fold hinges (Figure 10). This is a thesis by which soil sampling and local mine plans can be further scrutinised for discovery of the same controlling elements.
This prospect remains of significant potential as the southern part of the project also includes other mines by the name of Mons Meg (23,560 oz. at 17g/t) and Sambas (41,931 oz. at 33g/t). Sampling across an exposed face next to an open pit at Hit or Miss (Figure 11) found that low grade ‘disseminated’ or likely sulphide hosted wall rock mineralisation (2.4m @ 1.17 g/t) can occur in this prospect. If true, then a larger deposition of gold makes this prospect attractive. In summary, this prospect hosts two advanced areas of interest (purple ellipse) and several new trends (yellow ellipses).
Elgin-Hillsborough Prospect Area
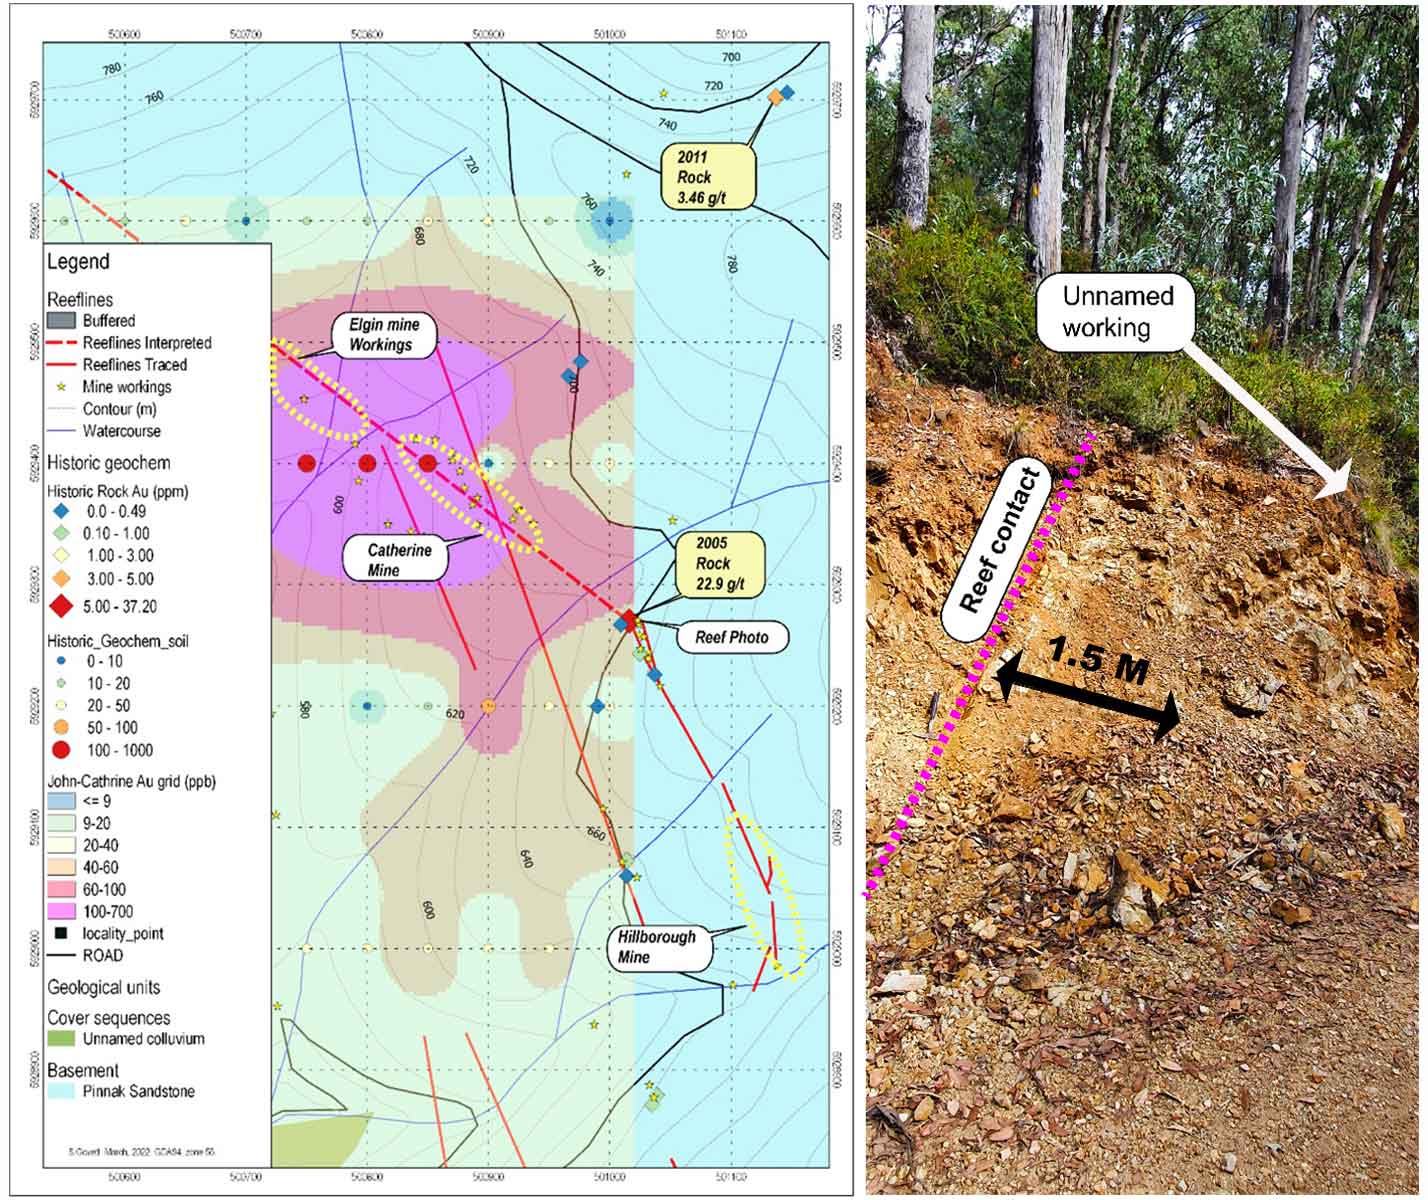
Fig. 13 Left – Historic soil geochemistry for gold by Golden Deeps Ltd in 2013 over Elgin-Catherine workings, and significant surface rock geochemistry by Target Minerals Pty Ltd in 2005 and Golden Deeps in 2011. • Fig. 12 Right – Recently exposed reef associated with trend between Hillsborough Mine and the Catherine-Elgin workings.
AIS recently observed a new track-side exposure explaining a high-grade rock sample (see reef photo Figure 12 and Figure 13). We will further investigate the exposure of this reef with detailed mapping and sampling. This reef meets the criteria of a significant mineralising structure on strike between the Elgin-Catharine workings and the Hillsborough Mine. The reef is approximately 1.5m wide and is likely associated with a rock sample by Target Minerals Pty Ltd in 2005 which returned 22.9 g/t gold.
The Elgin Mine is recorded as producing 3,831 oz. at 44g/t and Hillsborough produced 9,646 oz. at 24 g/t. Based on the results by Golden Deeps Ltd., this prospect is well placed for extending soil sampling over this outcrop and further south-east toward and beyond the Hillsborough Mine.
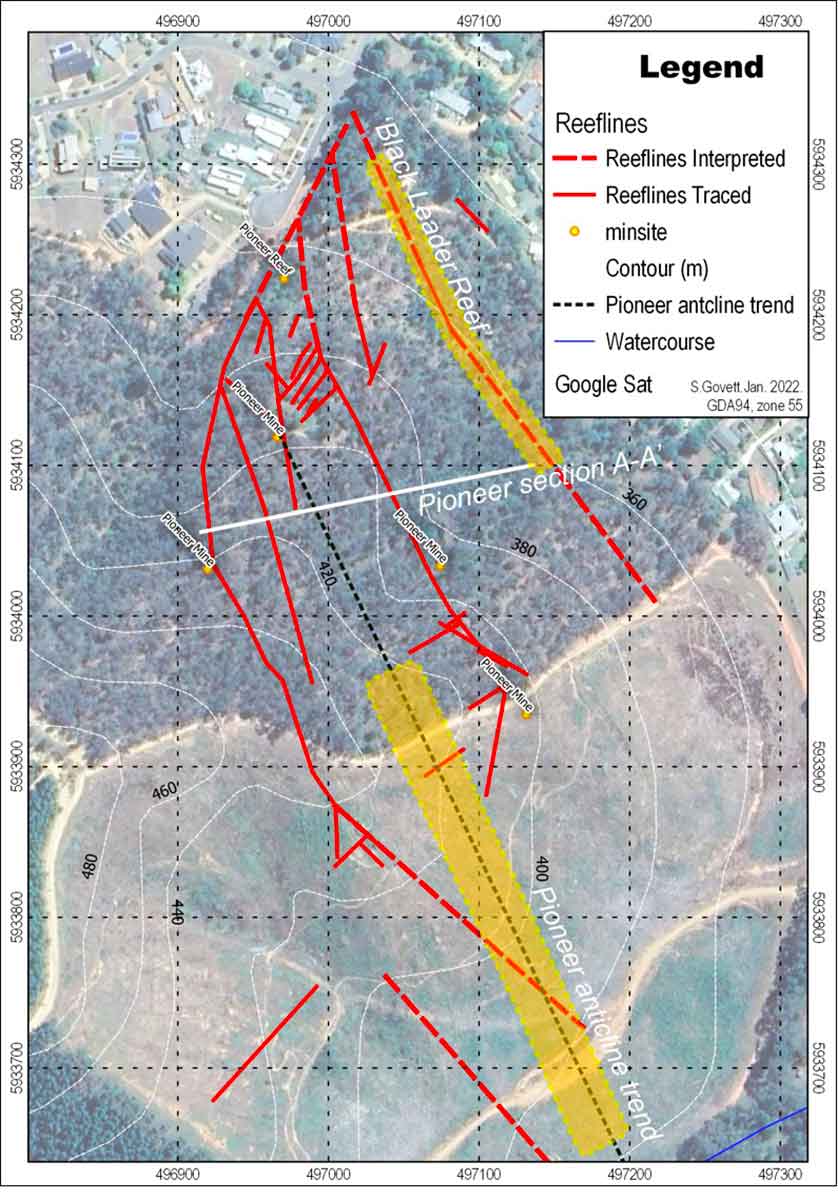
Fig. 14 – Plan of surface outcrop of historic mapped reef structures and trend of the Pioneer anticline.
Pioneer Prospect
Significant unrealised mineral potential exists at Pioneer, where no modern mining or meaningful exploration has occurred since it ceased operations. Three-dimensional modelling from mining records in the previous year demonstrated the potential for widths of quartz reef amenable to modern mining methods. Modelling from the plans retained at Pioneer demonstrate at least one north-east dipping reef that bulges at an axial plane and continues to surface. It was mined as the first hard rock source for gold in the region. Away from the fold, hinge widths appear at less than 0.5m. On intersecting the hinge, a ‘saddle’ style of reef occurs as west dipping limb reef which becomes wider (Figure 16). Modelling suggests that there are more than one, or a series of stacked reefs in proximity of the anticline.
At the intersect with the hinge this ‘bulge’ zone is up to 12m wide (Kenny, 1966)[1] and at the time of that writing it was quoted that the grade of this zone was 12.2 g/t. While mining the lower levels of this mine the No.5 adit intersected a reef called the Black Leader which was quoted as being between 0.3-2.0m wide and grading 20 oz/t (633 g/t)[2].
This prospect is the highest priority because of its high grades and stacked high-grade lodes. The significance of this prospect cannot be overstated, as the reef in this prospect was coherently mined (Figure 16) and 3D modelling recently revealled it as the same as the saddle reef[3] (Figure 15) found on the New Chum line in the Bendigo Goldfield.
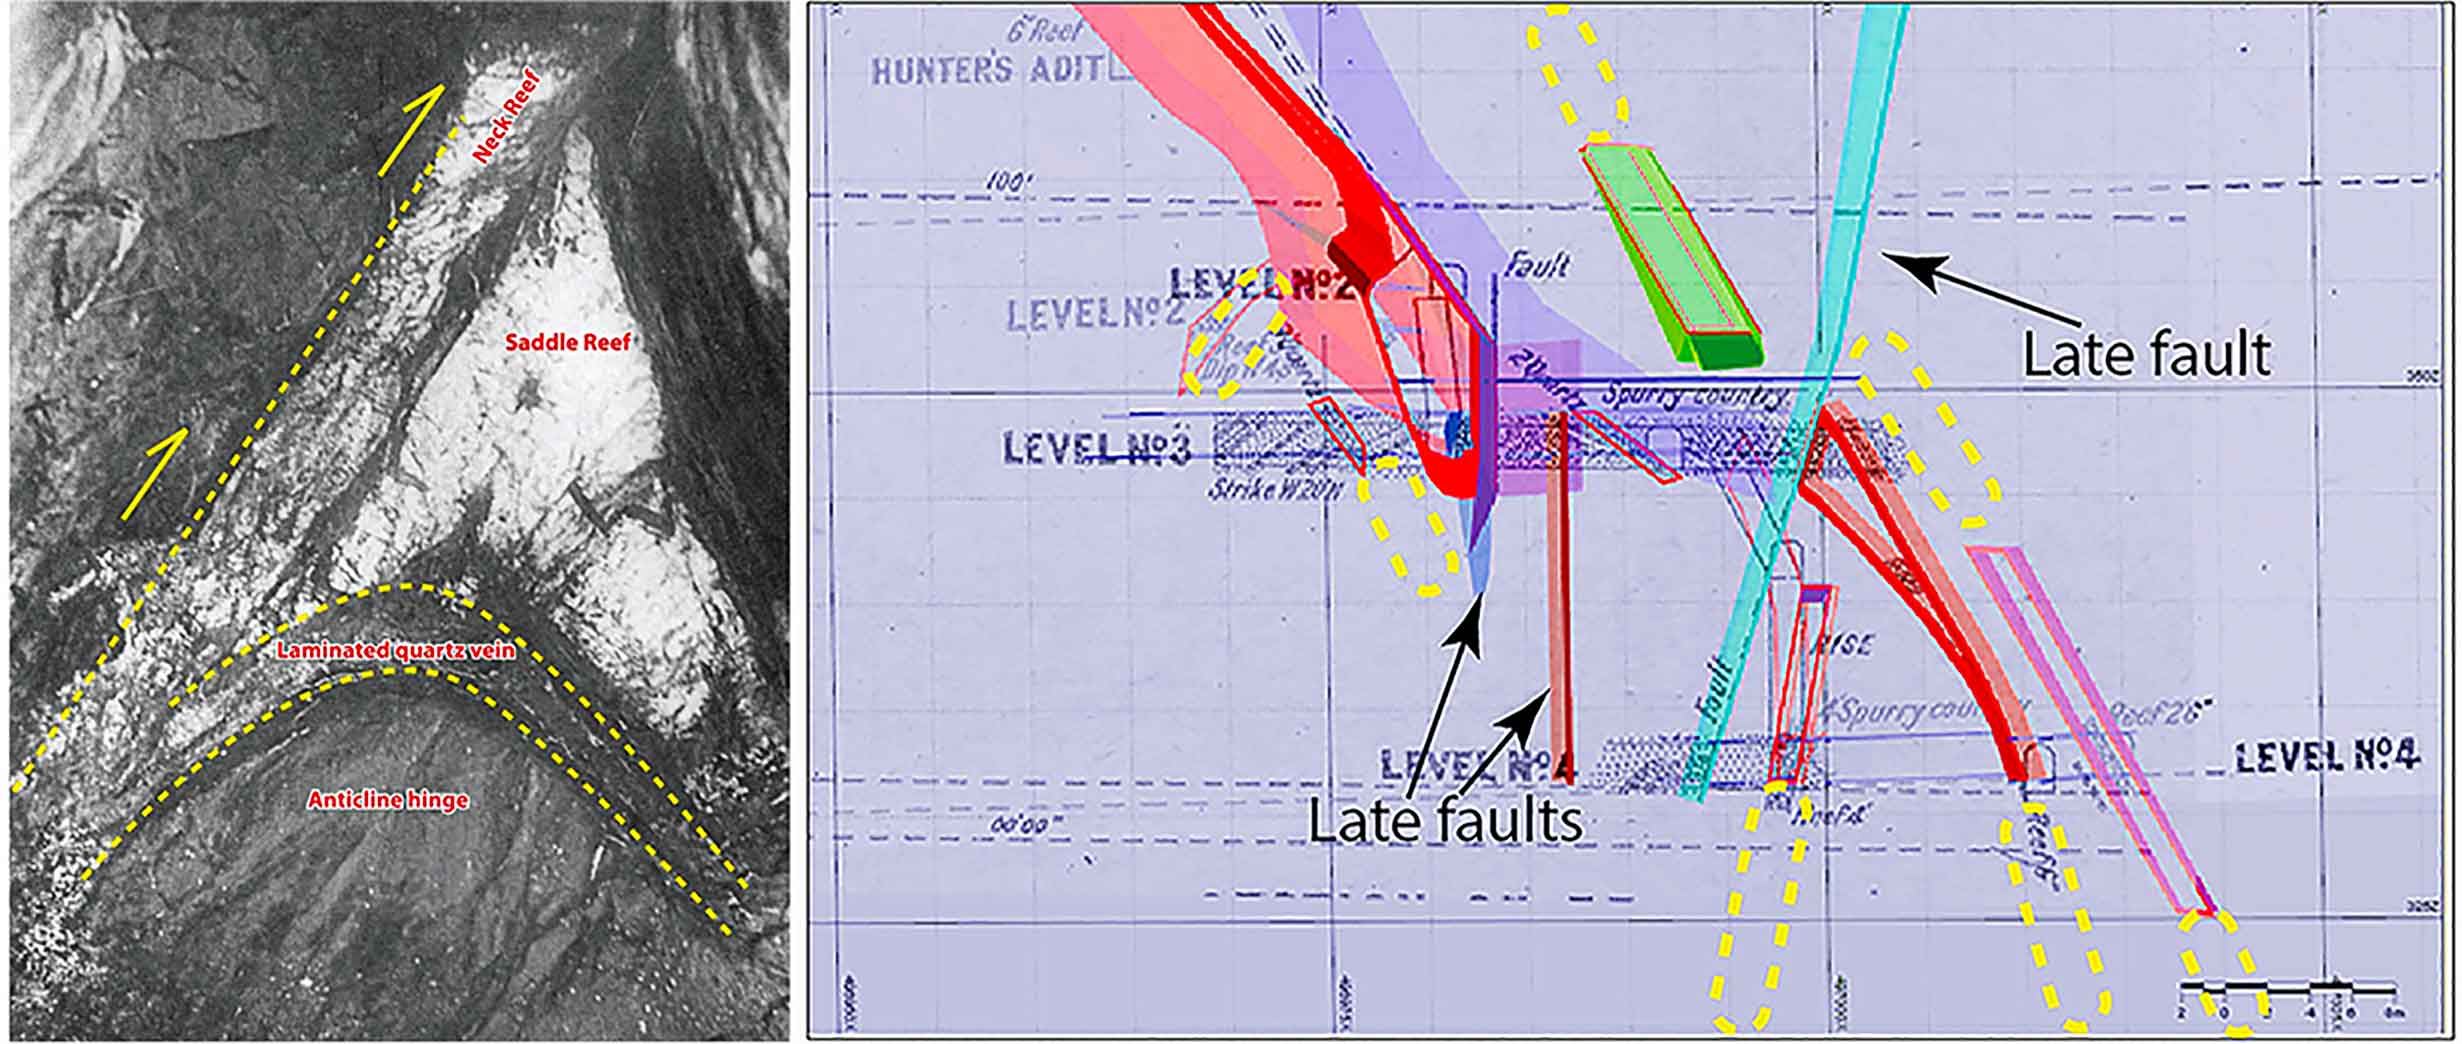
Fig. 15 – Saddle reef, east cross-cut, New Chum and Victoria Mine, Bendigo. Modified. • Fig. 16 – Bendigo style saddle reef, section A-A’ for Figure 14 at Pioneer Prospect.
Technical information in this news release has been reviewed and approved by Phillip Thomas, BSc Geol FAusIMM MAIG MAIMVA(CMV) who is a Qualified Person under the definitions established by the National Instrument 43-101.
About A.I.S. Resources Limited
A.I.S. Resources Limited is a publicly traded investment issuer listed on the TSX Venture Exchange focused on precious and base metals exploration. AIS’ value add strategy is to acquire prospective exploration projects and enhance their value by better defining the mineral resource with a view to attracting joint venture partners and enhancing the value of our portfolio. The Company is managed by a team of experienced geologists and investment bankers, with a track-record of successful capital markets achievements.
AIS owns 100% of the 28 sq km Fosterville-Toolleen Gold Project located 9.9km from Kirkland Lake’s Fosterville gold mine, a 60% interest in the 58 sq km New South Wales Yalgogrin Gold Project (with the right to acquire 100%), and 100% interest in the 167 sq km Kingston Gold Project in Victoria Australia near Stawell and Navarre. It also has joint venture interests with Spey Resources Corp in lithium brines in Argentina at Incahuasi and Pocitos Salars.
On Behalf of the Board of Directors,
AIS Resources Ltd.
Phillip Thomas, President & CEO
Corporate Contact
For further information, please contact:
Phillip Thomas, Chief Executive Officer
T: +1-747-200-9412
E: pt*****@**********es.com
Or
Martyn Element. Chairman
T: +1-604-220-6266
E: me******@**********es.com
Website: www.aisresources.com
Neither the TSX Venture Exchange nor its Regulation Services Provider (as that term is defined in the policies of the TSX Venture Exchange) accepts responsibility for the adequacy or accuracy of this release.
ADVISORY: This press release contains forward-looking statements. Although the Company believes that the expectations reflected in these forward-looking statements are reasonable, undue reliance should not be placed on them because the Company can give no assurance that they will prove to be correct. Since forward-looking statements address future events and conditions, by their very nature they involve inherent risks and uncertainties. The forward-looking statements contained in this press release are made as of the date hereof and the Company undertakes no obligations to update publicly or revise any forward-looking statements or information, whether as a result of new information, future events or otherwise, unless so required by applicable securities laws. Neither TSX Venture Exchange nor its Regulation Services Provider (as that term is defined in policies of the TSX Venture Exchange) accepts responsibility for the adequacy or accuracy of this release.
Appendix 1-GBDD001 Assay Summary
| HoleID | From (m) | To (m) | Width (m) | Au (ppm) | Au-Rp1
(ppm) |
Ag (ppm) | As
(ppm) |
| GBDD001 | 75.3 | 75.6 | 0.3 | X | 0.1 | 29.9 | |
| GBDD001 | 75.6 | 76 | 0.4 | X | X | 10.7 | |
| GBDD001 | 76 | 76.6 | 0.6 | X | X | 9.3 | |
| GBDD001 | 76.6 | 77.7 | 1.1 | 0.034 | X | 51.8 | |
| GBDD001 | 77.7 | 78.5 | 0.8 | 0.05 | X | 203 | |
| GBDD001 | 78.5 | 79.4 | 0.9 | 0.03 | X | 142.9 | |
| GBDD001 | 79.4 | 79.7 | 0.3 | 0.058 | X | 80.4 | |
| GBDD001 | 79.7 | 80.4 | 0.7 | 0.075 | X | 261.5 | |
| GBDD001 | 80.4 | 80.9 | 0.5 | 0.098 | X | 169.9 | |
| GBDD001 | 80.9 | 81.7 | 0.8 | 0.045 | X | 503.2 | |
| GBDD001 | 81.7 | 82.5 | 0.8 | 0.065 | 0.08 | 2949.1 | |
| GBDD001 | 82.5 | 83 | 0.5 | 0.042 | X | 1310.6 | |
| GBDD001 | 83 | 83.3 | 0.3 | 0.005 | X | 138.9 | |
| GBDD001 | 83.3 | 84 | 0.7 | 0.011 | X | 50.2 | |
| GBDD001 | 84 | 85 | 1 | 0.009 | X | 38 | |
| GBDD001 | 85 | 86 | 1 | 0.05 | X | 49.7 | |
| GBDD001 | 86 | 86.7 | 0.7 | 0.151 | X | 506.5 | |
| GBDD001 | 86.7 | 87.6 | 0.9 | 0.041 | X | 48.2 | |
| GBDD001 | 87.6 | 88.1 | 0.5 | 0.093 | X | 60.2 | |
| GBDD001 | 88.1 | 89.1 | 1 | 0.194 | 0.07 | 827.6 | |
| GBDD001 | 89.1 | 89.7 | 0.6 | 0.201 | X | 214 | |
| GBDD001 | 89.7 | 90.25 | 0.55 | 0.043 | X | 65.4 | |
| GBDD001 | 90.25 | 90.6 | 0.35 | 0.053 | X | 670.9 | |
| GBDD001 | 90.6 | 90.85 | 0.25 | 0.087 | X | 63.1 | |
| GBDD001 | 90.85 | 91.2 | 0.35 | 0.167 | X | 885.1 | |
| GBDD001 | 91.2 | 91.5 | 0.3 | 0.259 | 0.06 | 46.3 | |
| GBDD001 | 91.5 | 92.7 | 1.2 | 0.019 | X | 30.9 | |
| GBDD001 | 92.7 | 93.25 | 0.55 | 0.011 | X | 24.8 | |
| GBDD001 | 93.25 | 94.15 | 0.9 | 0.049 | X | 131.1 | |
| GBDD001 | 94.15 | 95.25 | 1.1 | 0.145 | X | 86.9 | |
| GBDD001 | 95.25 | 95.55 | 0.3 | 0.056 | X | 55.4 | |
| GBDD001 | 95.55 | 95.95 | 0.4 | 0.062 | X | 211.7 | |
| GBDD001 | 95.95 | 96.7 | 0.75 | 0.053 | X | 138.4 | |
| GBDD001 | 96.7 | 97.05 | 0.35 | 0.193 | X | 4566.4 | |
| GBDD001 | 97.05 | 97.65 | 0.6 | 0.319 | 0.309 | X | 11144 |
| GBDD001 | 97.65 | 98.25 | 0.6 | 0.062 | X | 1508.1 | |
| GBDD001 | 98.25 | 98.85 | 0.6 | 0.584 | 0.586 | X | 3780.8 |
| GBDD001 | 98.85 | 99.25 | 0.4 | 0.459 | X | 225.8 | |
| GBDD001 | 99.25 | 99.55 | 0.3 | 0.368 | X | 172.4 | |
| GBDD001 | 99.55 | 99.9 | 0.35 | 0.04 | X | 50.1 |
Table 2 – Significant analytes for GBDD001.
Appendix 2
| Goldfield | Mine/Reef | From | To | Ore (t) | Oz. | Kg | grade (g/t) |
| Pioneer | 1861 | 1909 | 26,165 | 11,050 | 344 | 13 | |
| Hillsborough | 1873 | 1895 | 12,765 | 9,646 | 300 | 24 | |
| Mt Orient | 1879 | 1903 | 6,885 | 6,197 | 193 | 28 | |
| Wallaby | 1868 | 1891 | 6,466 | 5,847 | 182 | 28 | |
| Try Again | 1866 | 1909 | 7,134 | 5,825 | 181 | 25 | |
| Homeward Bound | 1870 | 1877 | 12,141 | 5,505 | 171 | 14 | |
| Richardsons | 1860 | 1872 | 2,812 | 5,433 | 169 | 60 | |
| Elgin | 1871 | 1871 | 2,684 | 3,831 | 119 | 44 | |
| Bright—Wandiligong— Freeburgh | English and Welsh | 1872 | 1881 | 4,135 | 3,408 | 106 | 26 |
| Reliance | 1860 | 1879 | 6,712 | 3,119 | 97 | 14 | |
| Magpie | 1871 | 1906 | 2,963 | 2,848 | 89 | 30 | |
| Ebenezer | 1861 | 1877 | 2,069 | 2,434 | 76 | 37 | |
| Victoria | 1861 | 1885 | 1,512 | 2,348 | 73 | 48 | |
| Birthday | 1876 | 1881 | 2,976 | 1,864 | 58 | 19 | |
| Cornishmans | 1860 | 1884 | 1,485 | 1,678 | 52 | 35 | |
| New Moon | 1869 | 1871 | 1,382 | 1,671 | 52 | 38 | |
| Blowfly | 1879 | 1891 | 687 | 1,661 | 52 | 75 | |
| Woolshed | 1861 | 1882 | 1,615 | 1,538 | 48 | 30 | |
| Morgan Davis | 1862 | 1886 | 666 | 1,068 | 33 | 50 | |
| Harp of Erin Co. | 1869 | 1878 | 4,369 | 1,052 | 33 | 7 | |
| Rose, Thistle, & Shamrock | 1861 | 1933 | 119,175 | 77,872 | 2,422 | 20 | |
| Sambas | 1910 | 1970 | 39,624 | 41,931 | 1,304 | 33 | |
| Mons Meg | 1880 | 1895 | 42,759 | 23,560 | 733 | 17 | |
| United Miners | 1867 | 1884 | 34,674 | 19,332 | 601 | 17 | |
| Tiddledee & Money King | 1869 | 1890 | 12,919 | 15,871 | 494 | 38 | |
| Johnsons & Lady Jane | 1867 | 1940 | 39,635 | 12,535 | 390 | 10 | |
| Red Robin | 1941 | 1992 | 4,000 | 6,761 | 210 | 53 | |
| Crescent | 1890 | 1899 | 8,128 | 5,999 | 187 | 23 | |
| Jackass | 1878 | 1889 | 1,870 | 5,970 | 186 | 99 | |
| Harrietville | Monarch | 1896 | 1916 | 3,300 | 4,164 | 130 | 39 |
| Guerdon | 1884 | 1909 | 8,128 | 3,937 | 122 | 15 | |
| Biplane | 1920 | 1925 | 6,924 | 3,762 | 117 | 17 | |
| Buckeye | 1877 | 1909 | 2,258 | 3,503 | 109 | 48 | |
| Big Gun Extended | 1890 | 1917 | 5,288 | 2,929 | 91 | 17 | |
| Champion | 1863 | 1882 | 967 | 2,271 | 71 | 73 | |
| Landtax | 1878 | 1880 | 2,929 | 2,244 | 70 | 24 | |
| Unity | 1867 | 1883 | 1,053 | 1,858 | 58 | 55 | |
| Hit or Miss | 1861 | 1922 | 1,127 | 1,166 | 36 | 32 | |
| Never Too Late | 1874 | 1877 | 2,692 | 1,095 | 34 | 13 | |
| Total | 445,073 (t) | 314,783 (oz.) | 9,793 (kg) | 22 (g/t) |
Table 3 – Hardrock production[10] across the whole of the greater Bright goldfield region. Note: these figures encompass the all the production within EL6194 and includes mines outside the license. The table is tended to provide for a sense of grades within the tenement. Table include mines with production greater than 1,000 oz. Note: list doe does not include mines of the Golden Bar prospect.
Footnotes
[1] Geological Survey of Victoria Bulletin No.44, pp.39-40. See appendix 2
[2] Ibid
[3] Modified from mine plan (G35053_R2067B1), Kenny 1934
[4] KENNY, J.P.L., 1937. Rose, Thistle, and Shamrock Mine, Harrietville. Records of the Geological Survey of Victoria Volume 5, part 4, pp. 663
[5] Ibid.
[6] Ibid
[7] Geological Survey of Victoria Bulletin No.44, pp.14
[8] Ibid
[9] Reports on the Bendigo Gold-Field (Nos 1 and 2). Geological Survey of Victoria, 1896.
[10] “Bogong 1:100 000 map area geological report” GeoScience Victoria. Geological Survey of Victoria Report 125, 2005, pp149.
![[Most Recent Quotes from www.kitco.com]](https://www.kitconet.com/charts/metals/gold/tny_au_en_usoz_2.gif)

